homologyviz package
Subpackages
Submodules
homologyviz.app module
Initialize and run the HomologyViz graphical user interface.
This module serves as the entry point for launching the HomologyViz Dash application. It sets up the app layout, registers interactive callbacks, and opens the app in the default web browser.
Notes
This file is part of HomologyViz
BSD 3-Clause License
Copyright (c) 2024, Iván Muñoz Gutiérrez
homologyviz.arrow module
Class for plotting arrows to represent genes.
Notes
This file is part of HomologyViz
BSD 3-Clause License
Copyright (c) 2024, Iván Muñoz Gutiérrez
- class homologyviz.arrow.Arrow(x1, x2, y, ratio_tail_head_width=0.5, head_width=2, head_height=200)[source]
Bases:
objectGenerate coordinates for plotting horizontal arrow shapes.
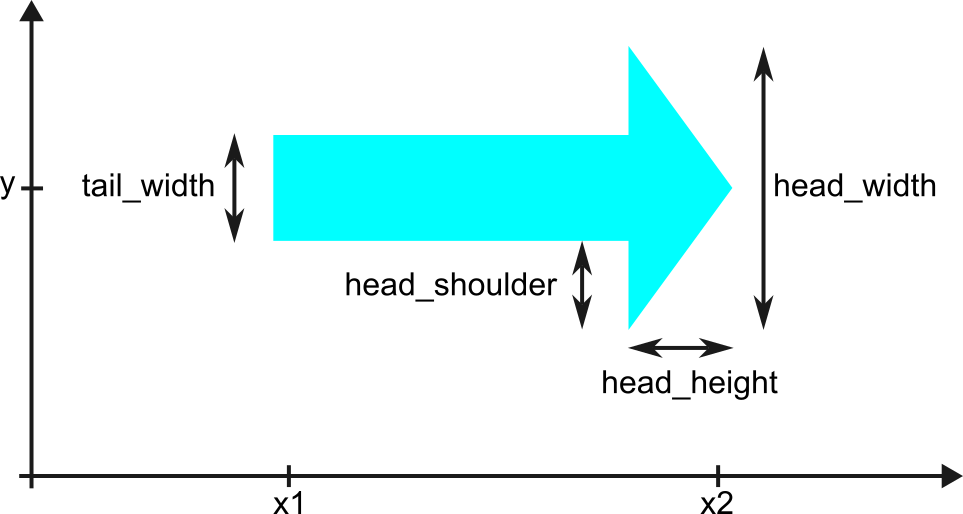
This class computes the (x, y) coordinates needed to plot an arrow pointing left or right, representing genes or features along DNA sequences.
The arrow consists of a rectangular tail and a triangular head. If the arrow is shorter than the specified head height, only the triangular head is drawn. The head and tail dimensions are customizable.
- x1
Start position along the x-axis.
- Type:
int or float
- x2
End position along the x-axis.
- Type:
int or float
- y
Vertical position along the y-axis.
- Type:
int or float
- ratio_tail_head_width
Ratio of tail width to head width. Default is 0.5.
- Type:
float
- head_width
Width of the arrowhead in the y-axis.
- Type:
int or float
- head_height
Length of the arrowhead in the x-axis.
- Type:
int or float
- tail_width
Computed width of the tail based on head_width and ratio_tail_head_width.
- Type:
float
- head_shoulder
Distance from the top/bottom of the tail to the top/bottom of the head.
- Type:
float
- coordinates_arrow_forward()[source]
Compute coordinates for a right-pointing arrow.
- Returns:
Arrays representing x and y coordinates of the arrow polygon.
- Return type:
tuple of np.ndarray
homologyviz.callbacks module
Register Dash callback functions for the HomologyViz graphical interface.
This module wires together the core interactive components of the app, including: - File upload and deletion for GenBank files - Plot generation using BLASTn alignments - UI controls for adjusting annotations, homology colors, and visibility - Custom color selection and trace selection logic - Application reset and download features - Heartbeat monitoring to shut down the app when the browser tab is closed
All callbacks are registered through the register_callbacks(app) function.
Notes
This file is part of HomologyViz
BSD 3-Clause License
Copyright (c) 2024, Iván Muñoz Gutiérrez
- class homologyviz.callbacks.HeartBeatsParameters(last_heartbeat=None, timeout_seconds=5, heartbeat_monitor_started=False)[source]
Bases:
objectParameters to monitor heart beats of the Dash app.
The monitoring of the heart beats allows to stop the server when the app tab is closed in the browser.
- last_heartbeat
A dictionary storing the timestamp of the last heartbeat and a counter.
- Type:
dict
- timeout_seconds
The number of seconds before a timeout occurs if no heartbeat is received.
- Type:
int
- heartbeat_monitor_started
Whether the heartbeat monitor has been started
- Type:
bool
- homologyviz.callbacks.align_plot(figure_state, dash_parameters, align_plot_state)[source]
Align the homology plot to the left, center, or right based on user preference.
If the selected alignment differs from the current one stored in dash_parameters, a new figure is generated. Otherwise, the existing figure state is converted back to a Plotly Figure object.
- Parameters:
figure_state (dict) – Dictionary representing the current Plotly figure, retrieved from dcc.Graph via Dash State.
dash_parameters (PlotParameters) – Object holding all plotting configuration and data.
align_plot_state (str) – Layout preference for positioning the alignments in the plot (e.g. “left”, “center”, “right”).
- Returns:
fig – The updated or restored Plotly figure.
- Return type:
plotly.graph_objects.Figure
- homologyviz.callbacks.change_color_cell_cds_dataframe(cds_dataframe, file_number, cds_number, new_color)[source]
Update the color value for a specific coding sequence in the DataFrame.
This function locates the row in the cds_dataframe corresponding to the given file_number and cds_number, and updates the value in the “color” column to the specified new_color. The function modifies the DataFrame in place.
- Parameters:
cds_dataframe (pandas.DataFrame) – The DataFrame containig coding sequence data, including columns “file_number”, “cds_number”, and “color”.
file_number (int) – The file identifier used to locate the target row.
cds_number (int) – The CDS idenfifier used to locate the target row.
new_color (str) – The new color value to assign, typically in hexadecimal format.
- Returns:
The input DataFrame is modified in place.
- Return type:
None
- homologyviz.callbacks.check_plot_parameters_for_update_homologies(dash_parameters, color_scale_state, range_slider_state, is_set_to_extreme_homologies)[source]
Check if plotting parameters for homology regions provided by the user are the same as the current stored values in the PlotParameters Object
If values are the same return False. Otherwise, update PlotParameters values and return True
- Parameters:
dash_parameters (PlotParameters) – Object holding all plotting configuration and data
color_scale_state (str) – Name of the color scale used to represent homology identity levels
range_slider_state (list[int, int]) – Percent identity range (e.g. [50, 100]) selected by the used to define color scalling.
is_set_to_extreme_homologies (bool) – Whether to stretch the color scale to the min/max homology identity values in the data
- Returns:
A flag to indicate if values are the same (True) or not (False)
- Return type:
bool
- homologyviz.callbacks.handle_change_color_click(figure_state, dash_parameters, color_input_state)[source]
Change color of selected traces.
Applies the chosen color to all traces currently marked as selected in dash_parameters.selected_traces, then clears the selection list.
- Parameters:
figure_state (dict) – Dictionary representing the current Plotly figure, retrieved from dcc.Graph via Dash State.
dash_parameters (PlotParameters) – Object holding all plotting configuration and data, including selected traces.
color_input_state (str) – Hex color code (e.g., “#FF0000) selected by the user to apply to the selected traces
- Return type:
tuple[Figure,None,bool]- Returns:
fig (plotly.graph_objects.Figure) – The updated Plotly figure with modified trace colors.
None – Placeholder to reset ‘clickData’ in Dash callbacks
bool – A flag (False) to indicate that the dmc.Skeleton loading component should be hidden
- homologyviz.callbacks.handle_plot_button_click(dash_parameters, virtual, tmp_directory_path, align_plot_state, color_scale_state, range_slider_state, is_set_to_extreme_homologies, annotation_column_choice_state, annotate_genes_state, use_genes_info_from_state, homology_style_state, minimum_homology_length_state, scale_bar_state, title_input_state)[source]
Perform BLASTn alignments and generate a homology plot for Dash.
This function prepares alignments data from input files, sets plotting parameters, and generates a Plotly figure representing sequence alignments and homologies.
- Parameters:
dash_parameters (PlotParameters) – Object holding all plotting configuration and data.
virtual (list[dict[str, str]]) – Metadata for uploaded files, including file names and file paths.
tmp_directory_path (Path) – Path to the temporary folder for storing alignments results.
align_plot_state (str) – Layout preference for positioning the alignments in the plot (e.g. “left”, “center”, “right”).
color_scale_state (str) – Name of the color scale used to represent homology identity levels.
range_slider_state (list[int, int]) – Percent identity range (e.g. [50, 100]) selected by the used to define color scalling.
is_set_to_extreme_homologies (bool) – Whether to stretch the color scale to the min/max homology identity values in the data.
annotation_column_choice_state (str) – Wheter and how to annotate sequence names.
annotate_genes_state (str) – Whether gene features shold be annotated.
use_genes_info_from_state (str) – Indicate source for genes annotations (e.g. “CDS product”, “CDS gene”).
homology_style_state (str) – Whether the connections between homology regions are straight or curved (Bezier).
minimum_homology_length_state (int) – Minimum length of homology region to be displayed.
scale_bar_state (str) – Whether to include a scale bar in the plot.
title_input_state (str) – String holding the figure’s title.
- Return type:
tuple[Figure,None,bool]- Returns:
fig (plotly.graph_objects.Figure)
None – Placeholder to reset ‘clickData’ in Dash callbacks.
bool – A flag (False) to indicate that the dmc.Skeleton loading component should be hidden.
- homologyviz.callbacks.handle_select_traces_click(figure_state, dash_parameters, click_data)[source]
Handle click events on traces to toggle selection and update the figure.
This function stores the selected trace index from click_data, applies a visual selection effect (e.g., line color/width change), and allows toggling the selection on repeated clicks.
- Parameters:
figure_state (dict) – Dictionary representing the current Plotly figure, retrieved from dcc.Graph via Dash State.
dash_parameters (PlotParameters) – Object holding all plotting configuration and data.
click_data (dict) – Dictionary representing data about the clicked point, as returned by Dash’s clickData. Must contain a “points” list with “curveNumber” to identify the clicked trace.
- Return type:
tuple[Figure,None,bool]- Returns:
fig (plotly.graph_objects.Figure)
None – Placeholder to reset ‘clickData’ in Dash callbacks.
bool – A flag (False) to indicate that the dmc.Skeleton loading component should be hidden.
- homologyviz.callbacks.handle_update_homologies_click(figure_state, dash_parameters, color_scale_state, range_slider_state, is_set_to_extreme_homologies)[source]
Update the homology trace colors and regenerate the colorscale bar legend.
This function updates the figure based on a new colorscale or identity range, and regenerates the corresponding colorbar legend for homology visualization.
- Parameters:
figure_state (dict) – Dictionary representing the current Plotly figure, retrieved from dcc.Graph via Dash State
dash_parameters (PlotParameters) – Object holding all plotting configuration and data
color_scale_state (str) – Name of the color scale used to represent homology identity levels
range_slider_state (list[int, int]) – Percent identity range (e.g. [50, 100]) selected by the used to define color scalling.
is_set_to_extreme_homologies (bool) – Whether to stretch the color scale to the min/max homology identity values in the data
- Return type:
tuple[Figure,None,bool]- Returns:
fig (plotly.graph_objects.Figure)
None – Placeholder to reset ‘clickData’ in Dash callbacks
bool – A flag (False) to indicate that the dmc.Skeleton loading component should be hidden
- homologyviz.callbacks.handle_update_title_click(figure_state, dash_parameters, title_input_state)[source]
Handle update title button click and update the Plotly figure accordingly.
If the provided title is unchanged or only whitespace, the figure title is removed. Otherwise, the new title is set and centered.
- Parameters:
figure_state (dict) – Current Plotly figure state, retrieved from dcc.Graph via Dash callback.
dash_parameters (PlotParameters) – Object holding plotting configuration and metadata. This function updates its plot_title attribute.
title_input_state (str) – New title input from the user.
- Return type:
tuple[Figure,None,bool]- Returns:
fig (plotly.graph_objects.Figure) – The updated Plotly figure.
None – Placeholder to reset ‘clickData’ in Dash callbacks.
bool – False to hide the dmc.Skeleton loading indicator.
- homologyviz.callbacks.handle_update_view_click(figure_state, dash_parameters, align_plot_state, homology_style_state, use_genes_info_from_state, annotate_genes_state, scale_bar_state, minimum_homology_length_state)[source]
Handle the ‘update view’ button click event.
This function updates the current figure layout and annotations based on user preferences, including alignment positioning, gene/sequence annotations, scale bar visibility, and minimum homology length.
- Parameters:
figure_state (dict) – Dictionary representing the current Plotly figure, retrieved from dcc.Graph via Dash State.
dash_parameters (PlotParameters) – Object holding all plotting configuration and data.
align_plot_state (str) – Layout preference for positioning the alignments in the plot (e.g. “left”, “center”, “right”).
homology_style_state (str) – Whether the connections between homology regions are straight or curved (Bezier).
use_genes_info_from_state (str) – Indicate source for genes annotations (e.g. “CDS product”, “CDS gene”).
annotate_genes_state (str) – whether gene features shold be annotated.
scale_bar_state (str) – Whether to display the scale bar (“yes” or “no”).
minimum_homology_length_state (int) – Minimum length (in bp) of homology region to be displayed.
- Return type:
tuple[Figure,None,bool]- Returns:
fig (plotly.graph_objects.Figure) – The updated Plotly figure with applied user preferences.
None – Placeholder to reset ‘clickData’ in Dash callbacks.
bool – A flag (False) to indicate that the dmc.Skeleton loading component should be hidden.
- homologyviz.callbacks.register_callbacks(app)[source]
Register all Dash callbacks for the app, including plotting logic, UI interactins, and server shutdown monitoring.
- This function sets up the full interactivity of the Dash app, including:
Handling file uploads and deletions.
Executing BLASTn alignments and plotting homology regions.
Updating annotations, colors, layout, and display options.
Managing UI elements like buttons, skeleton loaders, and input states.
Generating downloadable figures in various formats.
Monitoring heartbeat pings from the frontend to detect tab closure and gracefully shut down the app server when inactive.
- Parameters:
app (dash.Dash) – The Dash app instance to which all callback functions and server routes will be attached.
- Returns:
The same Dash app instance, now with all callbacks registered.
- Return type:
dash.Dash
- homologyviz.callbacks.save_uploaded_file(file_name, content, temp_folder_path)[source]
Decode the content and write it to a temporary file.
Returns the file path as a string if successful, otherwise returns None.
- Return type:
str|None
- homologyviz.callbacks.update_dna_sequence_annotations(fig, dash_parameters, annotation_column_choice_state, table)[source]
Update DNA sequence annotations in the Plotly figure based on user-selected annotations options.
This function is triggered when the user edits the Annotations/Sequences dropdown in the Edit tab of the app. It removes existing DNA sequence annotations and re-adds them based on the current user selection. It also updates the ‘custom_name’ column in the GenBank DataFrame.
- Parameters:
fig (plotly.graph_objects.Figure) – The Plotly figure containing the DNA sequence tracks and annotations.
dash_parameters (PlotParameters) – An object containing state variables for plotting, such as GenBank data and annotation preferences.
annotation_column_choice_state (str) – The column name selected by the user to annotate sequences with. Use “no” to disable annotations.
table (list of dict) – A list of dictionaries representing the rows in the editable sequence table. Each dictionary must include a “custom_name” field.
- Returns:
The updated figure with DNA sequence annotations added or removed based on user input.
- Return type:
plotly.graph_objects.Figure
- homologyviz.callbacks.update_gb_dataframe_custom_name(table, gb_df)[source]
Update the ‘custom_name’ column of a DataFrame using values from a table of dictionaries.
- Parameters:
table (list of dict) – A list where each dictionary contain a ‘custom_name’ key.
gb_df (pandas.DataFrame) – The DataFrame whose ‘custom_name’ column will be updated.
- Returns:
The updated DataFrame with the ‘custom_name’ column set from table.
- Return type:
pandas.DataFrame
- homologyviz.callbacks.update_genes_annotations(fig, dash_parameters, use_genes_info_from_state, annotate_genes_state)[source]
Update genes annotations in the plot based on user preferences.
If the user changes either the annotation source (e.g., product or gene) or the visibility of annotation (top, bottom, both, or none), the function updates the figure accordingly. If no change are neede, the input figure is returned unchanged.
- Parameters:
fig (plotly.graph_objects.Figure.) – The current Plotly figure to update.
dash_parameters (PlotParameters) – Object holding all plotting configuration and data.
use_genes_info_from_state (str) – Source of gene annotation labels (e.g., “CDS product”, “CDS gene”).
annotate_genes_state (str) – Desired gene annotation display setting (e.g., “top”, “bottom”, “both”, “no”).
- Returns:
fig – The updated or original Plotly figure, depending on whether changes are needed.
- Return type:
plotly.graph_objects.Figure.
- homologyviz.callbacks.update_homology_regions(figure_state, dash_parameters, align_plot_state, homology_style_state)[source]
Update the homology region style and alignment position in the plot if user preferences change.
This function checks whether the user has requested a change to the style of homology region shading (e.g., Bezier vs. straight) or to the alignment position of the homology region plot (e.g., left, center, or right). If either preference has changed, the figure is redrawn using the updated parameters. Otherwise, the figure is reconstructed from the current figure state.
- Parameters:
figure_state (dict) – A dictionary containing the current Plotly figure’s ‘data’ and ‘layout’.
dash_parameters (PlotParameters) – An object storing the current state of plotting parameters, including alignment position and homology style.
align_plot_state (str) – The desired position of the homology alignment plot in the figure (‘left’, ‘center’, or ‘right’)
homology_style_state (str) – The desired visual style of homology regions (‘Bezier’ or ‘straight’).
- Returns:
The updated Plotly figure with the appropriate homology style and alignment position.
- Return type:
plotly.graph_objects.Figure
- homologyviz.callbacks.update_minimum_homology_length(fig, dash_parameters, minimum_homology_length_state)[source]
Update minimum homology length displayed in the plot based on user preferences.
If the user changes the minimum homology length setting, the function updates the figure accordingly by hidding homology regions shorter than the specified length. If no changes are needed, the input figure is returned unchanged.
- Parameters:
fig (plotly.graph_objects.Figure.) – The current Plotly figure to update.
dash_parameters (PlotParameters) – Object holding all plotting configuration and data.
minimum_homology_length_state (int) – The new minimum homology length to display in the plot.
- Returns:
fig – The updated or original Plotly figure, depending on whether changes are needed.
- Return type:
plotly.graph_objects.Figure
- homologyviz.callbacks.update_scale_bar(fig, dash_parameters, scale_bar_state)[source]
Update the visibility of the scale bar in the plot based on user preferences.
If the user changes the scale bar setting, the function updates the figure accordingly. If no changes are needed, the input figure is returned unchanged.
- Parameters:
fig (plotly.graph_objects.Figure.) – The current Plotly figure to update.
dash_parameters (PlotParameters) – Object holding all plotting configuration and data.
scale_bar_state (str) – Desired scale bar annotation display setting (“yes” to show, “no” to hide).
- Returns:
fig – The updated or original Plotly figure, depending on whether changes are needed.
- Return type:
plotly.graph_objects.Figure
homologyviz.cli module
Command-line interface (CLI) utilities for HomologyViz.
This module provides functions to parse command-line arguments and check system dependencies (e.g., presence of BLASTn). It supports the GUI launcher and can be extended for future command-line features.
Notes
This file is part of HomologyViz
BSD 3-Clause License
Copyright (c) 2024, Iván Muñoz Gutiérrez
- homologyviz.cli.parse_command_line_input()[source]
Parse command-line arguments and validate the environment.
This function sets up the command-line interface (CLI) for HomologyViz using argparse. It defines helper flags for displaying the help message and the program version, then parses user-provided arguments.
Additionally, it checks if blastn is installed locally. If blastn is not found, the program exits early to prevent runtime errors.
- Returns:
A namespace object containing parsed command-line arguments. Typically empty unless extended in the future.
- Return type:
argparse.Namespace
Notes
–help or -h: Show usage information.
–version or -v: Show the installed version of the CLI.
Exits the program if blastn is not installed locally.
homologyviz.gb_files_manipulation module
Utilities for processing GenBank files and BLASTn results in HomologyViz.
- This module provides functions to:
Convert GenBank (.gb) files to FASTA format for BLASTn (make_fasta_files).
Run local BLASTn alignments and capture XML results (run_blastn, blastn_command_line).
Parse BLASTn XML into structured DataFrames (get_blast_metadata, parse_blast_record).
Extract sequence- and feature-level metadata from GenBank records (genbank_files_metadata_to_dataframes, parse_genbank_cds_to_df).
Determine the longest sequence and homology bounds for plotting (get_longest_sequence_dataframe, find_lowest_and_highest_homology_dataframe).
These utilities underpin the data preparation pipeline for visualizing homology and gene annotations.
Notes
This file is part of HomologyViz
BSD 3-Clause License
Copyright (c) 2024, Iván Muñoz Gutiérrez
- homologyviz.gb_files_manipulation.adjust_positions_alignments_df_center(alignments, regions, size_longest_sequence)[source]
Center-align alignment regions for plotting relative to the longest sequence.
This function adjusts the plotting coordinates of each alignment region to center both the query and hit sequences. It shifts the *_plot columns (query_from_plot, query_to_plot, hit_from_plot, hit_to_plot) based on the difference between each alignment’s sequence length and the longest sequence in the dataset.
If alignments are not already left-aligned, they are reset using adjust_positions_alignments_df_left().
- Parameters:
alignments (pandas.DataFrame) –
- DataFrame containing BLAST alignment summary metadata. Must include:
’alignment_number’, ‘query_len’, ‘hit_len’.
regions (pandas.DataFrame) –
- DataFrame containing BLAST alignment region metadata. Must include:
’alignment_number’, ‘query_from_plot’, ‘query_to_plot’, ‘hit_from_plot’, ‘hit_to_plot’.
size_longest_sequence (int) – Length of the longest sequence in the dataset. Used to calculate the centering shift.
- Return type:
None
- homologyviz.gb_files_manipulation.adjust_positions_alignments_df_left(regions)[source]
Reset alignment plotting coordinates to their original (left-aligned) positions.
This function sets the plotting coordinates (*_plot columns) of BLAST alignment regions to match their original values from the BLAST output.
- Parameters:
regions (pandas.DataFrame) – DataFrame containing BLAST alignment region metadata. Must include the following columns: - ‘query_from’, ‘query_to’, ‘hit_from’, ‘hit_to’ - ‘query_from_plot’, ‘query_to_plot’, ‘hit_from_plot’, ‘hit_to_plot’
- Return type:
None
- homologyviz.gb_files_manipulation.adjust_positions_alignments_df_right(alignments, regions, size_longest_sequence)[source]
Right-align alignment regions for plotting relative to the longest sequence.
This function shifts the *_plot coordinates (query_from_plot, query_to_plot, hit_from_plot, hit_to_plot) of each region so that both query and hit alignments appear right-aligned in the plot.
If alignments are not already left-aligned, they are reset using adjust_positions_alignments_df_left().
- Parameters:
alignments (pandas.DataFrame) –
- DataFrame containing summary metadata for each alignment. Must include:
’alignment_number’, ‘query_len’, and ‘hit_len’.
regions (pandas.DataFrame) –
- DataFrame with alignment region metadata. Must include:
’alignment_number’, ‘query_from_plot’, ‘query_to_plot’, ‘hit_from_plot’, and ‘hit_to_plot’.
size_longest_sequence (int) – The length of the longest sequence in the dataset. Used to compute the right-shift offset for alignment display.
- Return type:
None
- homologyviz.gb_files_manipulation.adjust_positions_sequences_and_alignments_df_for_plotting(gb_records, cds, alignments, regions, size_longest_sequence=None, position='left')[source]
Adjust plotting coordinates for sequences, CDS features, and alignments.
This function dispatches layout adjustment functions to shift the positions of sequences, genes (CDS), and alignment regions based on the desired layout: left-, center-, or right-aligned. It modifies the relevant plotting columns (*_plot) in-place.
- Parameters:
gb_records (pandas.DataFrame) – DataFrame containing metadata for GenBank sequences. Must include ‘length’, ‘sequence_start’, ‘sequence_end’, and ‘file_number’.
cds (pandas.DataFrame) – DataFrame containing CDS metadata with columns such as ‘start’, ‘end’, ‘start_plot’, ‘end_plot’, and ‘file_number’.
alignments (pandas.DataFrame) – DataFrame summarizing each alignment. Must include ‘alignment_number’, ‘query_len’, and ‘hit_len’.
regions (pandas.DataFrame) – DataFrame describing aligned regions between sequences. Must include ‘alignment_number’, and the columns: ‘query_from_plot’, ‘query_to_plot’, ‘hit_from_plot’, ‘hit_to_plot’.
size_longest_sequence (int or None, optional) – Length of the longest sequence, used when centering or right-aligning. Not required if position=”left”.
position (str, default="left") – Layout alignment option for plotting. Must be one of: “left”, “center”, or “right”.
- Return type:
None
- homologyviz.gb_files_manipulation.adjust_positions_sequences_df_center(gb_records, cds, size_longest_sequence)[source]
Adjust plotting coordinates to center-align each sequence and its CDS features.
This function horizontally centers all sequences relative to the longest sequence. It modifies the sequence_start and sequence_end columns in gb_records, and adjusts the start_plot and end_plot coordinates in cds.
If the sequences are not already left-aligned, they are first reset to the left using adjust_positions_sequences_df_left.
- Parameters:
gb_records (pandas.DataFrame) – DataFrame containing metadata for GenBank sequences. Must include: - ‘length’, ‘sequence_start’, ‘sequence_end’, and ‘file_number’.
cds (pandas.DataFrame) – DataFrame containing CDS feature metadata. Must include: - ‘file_number’, ‘start_plot’, and ‘end_plot’.
size_longest_sequence (int) – Length of the longest sequence in the dataset. Used to compute the centering shift.
- Return type:
None
- homologyviz.gb_files_manipulation.adjust_positions_sequences_df_left(gb_records, cds)[source]
Align all sequences and CDS features to the left (start at 0) for plotting.
This function updates the sequence_start and sequence_end columns in the GenBank metadata DataFrame (gb_records), and also resets the CDS plotting coordinates (start_plot, end_plot) to match their original start and end positions.
- Parameters:
gb_records (pandas.DataFrame) – DataFrame containing metadata for GenBank sequences. Must include ‘length’, ‘sequence_start’, and ‘sequence_end’ columns.
cds (pandas.DataFrame) – DataFrame containing CDS feature metadata. Must include ‘start’, ‘end’, ‘start_plot’, and ‘end_plot’ columns.
- Return type:
None
- homologyviz.gb_files_manipulation.adjust_positions_sequences_df_right(gb_records, cds, size_longest_sequence)[source]
Adjust plotting coordinates to right-align sequences and CDS features.
This function horizontally right-aligns each sequence relative to the longest sequence. It updates the sequence_start and sequence_end columns in gb_records, and adjusts the CDS plotting coordinates (start_plot, end_plot) in cds.
If the sequences are not already left-aligned, they are reset using adjust_positions_sequences_df_left.
- Parameters:
gb_records (pandas.DataFrame) – DataFrame containing GenBank sequence metadata. Must include: - ‘length’, ‘sequence_start’, ‘sequence_end’, and ‘file_number’.
cds (pandas.DataFrame) – DataFrame containing CDS feature metadata. Must include: - ‘file_number’, ‘start_plot’, and ‘end_plot’.
size_longest_sequence (int) – Length of the longest sequence in the dataset. Used to calculate the shift needed to right-align shorter sequences.
- Return type:
None
- homologyviz.gb_files_manipulation.blastn_command_line(query, subject, out, outfmt=5)[source]
Run a local BLASTn alignment between two nucleotide sequences using the command line.
Executes BLASTn with the given query and subject FASTA files, writes results to the specified output file, and returns the standard output or error message.
- Parameters:
query (pathlib.Path) – Path to the query FASTA file.
subject (pathlib.Path) – Path to the subject FASTA file.
out (pathlib.Path) – Path to the file where BLASTn output will be written.
outfmt (int, default=5) – BLAST output format (5 = XML). HomologyViz requires XML format for parsing.
- Returns:
The standard output from the BLASTn command if successful, or the error message if the command fails.
- Return type:
str
Notes
Both query and subject must be valid nucleotide FASTA files.
The default output format (XML) is required for compatibility with HomologyViz.
- homologyviz.gb_files_manipulation.check_if_alignments_are_at_left(regions)[source]
Check whether alignment regions are left-aligned.
This function compares the plotting start coordinates (query_from_plot) with the original BLAST start coordinates (query_from). If they match for all rows, the function returns True, indicating that no offset has been applied.
- Parameters:
regions (pandas.DataFrame) – DataFrame containing alignment region metadata. Must include the columns ‘query_from’ and ‘query_from_plot’.
- Returns:
True if all alignment regions are left-aligned, False otherwise.
- Return type:
bool
- homologyviz.gb_files_manipulation.check_if_sequences_are_at_left(cds)[source]
Check whether CDS features are left-aligned for plotting.
This function compares the plotting start positions (start_plot) to the original genomic start positions (start) for all coding sequences. If all rows match, the sequences are considered left-aligned.
- Parameters:
cds (pandas.DataFrame) – DataFrame containing CDS feature metadata. Must include ‘start’ and ‘start_plot’ columns.
- Returns:
True if all CDS start positions are left-aligned, False otherwise.
- Return type:
bool
- homologyviz.gb_files_manipulation.find_lowest_and_highest_homology_dataframe(regions_df)[source]
Compute the minimum and maximum homology values from the regions DataFrame.
- Parameters:
regions_df (pandas.DataFrame) – DataFrame containing homology region metadata. Must include a ‘homology’ column with float values between 0 and 1.
- Return type:
tuple- Returns:
lowest (float) – The smallest homology value in regions_df.
highest (float) – The largest homology value in regions_df.
- homologyviz.gb_files_manipulation.genbank_files_metadata_to_dataframes(gb_files)[source]
Parse GenBank files and return sequence and CDS metadata as structured DataFrames.
This function reads a list of GenBank files and extracts relevant metadata for downstream plotting or analysis. It separates the data into two related tables: one for general sequence information (gb_df) and one for coding sequences (cds_df).
- Parameters:
gb_files (list of pathlib.Path) – List of paths to GenBank (.gb) files.
- Return type:
tuple[DataFrame,DataFrame]- Returns:
gb_df (pandas.DataFrame) –
- DataFrame with GenBank record-level metadata, including:
file number, file path, file name, custom_name, record name, accession, sequence length, and plotting coordinates (sequence_start, sequence_end).
cds_df (pandas.DataFrame) –
- DataFrame with CDS (gene) feature metadata from all GenBank files, including:
file number, accession, gene name, product name, strand, color (if available), and plotting coordinates (start_plot, end_plot).
Notes
These two DataFrames are linked via the file_number and accession fields.
- homologyviz.gb_files_manipulation.get_blast_metadata(xml_alignment_result)[source]
Parse BLASTn XML result files into structured Pandas DataFrames.
This function extracts both summary and detailed region metadata from a list of BLASTn XML result files, returning two linked DataFrames: - alignments_df: High-level metadata for each BLAST alignment. - regions_df: Local matching regions for each alignment.
- Parameters:
xml_alignment_result (list of pathlib.Path) – List of paths to XML-formatted BLASTn result files (outfmt=5).
- Return type:
tuple[DataFrame,DataFrame]- Returns:
alignments_df (pandas.DataFrame) –
- Summary table with one row per alignment. Columns include:
alignment_number (int): Unique alignment index
query_name (str): Query sequence ID
hit_name (str): Subject sequence ID
query_len (int): Query sequence length
hit_len (int): Subject sequence length
regions_df (pandas.DataFrame) – Detailed region-level metadata for all matching regions across alignments. Includes start/end positions and identity metrics. Each row corresponds to one HSP (high-scoring pair). The alignment_number field links this table to alignments_df.
Notes
For additional region-level metadata, see the parse_blast_record function.
- homologyviz.gb_files_manipulation.get_longest_sequence_dataframe(gb_records)[source]
Return the length of the longest sequence from the GenBank metadata DataFrame.
- Parameters:
gb_records (pandas.DataFrame) – DataFrame containing GenBank metadata. Must include a ‘length’ column.
- Returns:
The length (in base pairs) of the longest sequence in the dataset.
- Return type:
int
- homologyviz.gb_files_manipulation.make_fasta_files(gb_files, output_path)[source]
Convert GenBank files to FASTA format for downstream processing (e.g., BLASTn).
Each input GenBank file is parsed to extract its sequence and metadata, and a corresponding FASTA (.faa) file is written to the specified output folder.
- Parameters:
gb_files (list of pathlib.Path) – List of paths to GenBank (.gb) files to be converted.
output_path (pathlib.Path) – Directory where the resulting FASTA files will be saved.
- Returns:
List of paths to the generated FASTA (.faa) files.
- Return type:
list of pathlib.Path
- homologyviz.gb_files_manipulation.parse_blast_record(blast_record, alignment_number)[source]
Parse a BLAST record and extract metadata for all matching regions (HSPs).
This function processes the first alignment in a BLAST record and extracts key information about each high-scoring pair (HSP), including coordinate ranges, identity metrics, and computed homology. It returns a DataFrame with one row per region, ready for downstream plotting or filtering.
- Parameters:
blast_record (Bio.Blast.Record) – A parsed BLAST record object from Bio.Blast.NCBIXML.read(). Must contain at least one alignment with HSPs.
alignment_number (int) – Unique index for this alignment, used to link with the summary DataFrame.
- Returns:
DataFrame where each row represents a BLAST high-scoring pair (HSP). Includes both raw start/end coordinates and pre-scaled values for plotting.
Columns: - alignment_number : int - query_from, query_to : float - query_from_plot, query_to_plot : float - hit_from, hit_to : float - hit_from_plot, hit_to_plot : float - identity : int (number of identical matches) - positive : int (number of positive-scoring matches) - align_len : int (alignment length) - homology : float (identity / alignment length)
- Return type:
pandas.DataFrame
- homologyviz.gb_files_manipulation.parse_genbank_cds_to_df(record, file_number, accession)[source]
Extract CDS feature metadata from a GenBank record and return it as a DataFrame.
This function parses a Bio.SeqRecord GenBank object and compiles information from all its CDS features.
- Parameters:
record (Bio.SeqRecord.SeqRecord) – The parsed GenBank record to extract CDS data from.
file_number (int) – Index of the GenBank file, used for relational tracking.
accession (str) – Accession ID of the sequence, used for relational grouping.
- Returns:
A DataFrame with one row per CDS part, containing the following columns: - file_number: index of source file - cds_number: index of the CDS feature within the record - accession: accession ID of the sequence - gene: gene name (if available) - product: protein product name (if available) - start, end: sequence coordinates (1-based) - strand: strand orientation (+1 or -1) - color: gene color (from /Color qualifier, or default “#ffff00”) - start_plot, end_plot: adjusted coordinates for plotting purposes
- Return type:
pandas.DataFrame
Notes
Each part of a multi-segment CDS is treated as a separate row.
Start/end coordinates are stored as floats for consistency with plotting tools.
- homologyviz.gb_files_manipulation.run_blastn(faa_files, output_path)[source]
Run local BLASTn alignments between consecutive FASTA files and save results in XML format.
For a given list of FASTA files, this function performs pairwise comparisons in order: file[0] vs file[1], file[1] vs file[2], and so on. The results are saved as XML files using BLAST output format 5.
- Parameters:
faa_files (list of pathlib.Path) – List of paths to nucleotide FASTA (.faa) files to be compared.
output_path (pathlib.Path) – Directory where the resulting BLASTn XML output files will be saved.
- Returns:
List of paths to the BLASTn result files in XML format.
- Return type:
list of pathlib.Path
homologyviz.layout module
Define the layout for the HomologyViz graphical user interface (GUI).
This module builds the entire front-end layout of the HomologyViz Dash application using Dash Mantine Components (DMC), Dash Bootstrap Components (DBC), and Plotly Graphs. The GUI includes interactive controls to upload files, edit plots, adjust views, and export figures. It is structured into multiple tabs—Main, View, Edit, and Save—and integrates seamlessly with Dash callbacks.
Notes
This file is part of HomologyViz
BSD 3-Clause License
Copyright (c) 2024, Iván Muñoz Gutiérrez
- homologyviz.layout.create_layout(app)[source]
Construct the full layout for the HomologyViz Dash app.
This function defines the GUI structure, including the control panel and plot display. It uses Dash Mantine Components for styling and layout organization. The layout is composed of two primary columns:
Left Column: Control panel with the HomologyViz logo and tabbed interface for uploading files, customizing views, editing plots, and saving outputs.
Right Column: Main plotting area displaying the generated figure using dcc.Graph, wrapped in a dmc.Skeleton for loading effects.
- Parameters:
app (dash.Dash) – The Dash application instance to which the layout will be assigned.
- Returns:
The Dash app with its layout fully configured and assigned.
- Return type:
dash.Dash
- homologyviz.layout.list_sequential_color_scales()[source]
List all Plotly sequential color scales.
This function returns the names of all sequential color scale options available in plotly.express.colors.sequential. These color scales are typically used for gradient-style visualizations such as heatmaps or homology identity shading.
- Returns:
A list of sequential color scale names (e.g., “Viridis”, “Blues”, “Greys”).
- Return type:
list of str
- homologyviz.layout.make_accordion_item_edit_color()[source]
Create a Dash Mantine Components AccordionItem for editing the color of selected items.
This UI component includes:
A ColorInput widget for selecting a color (HEX format) from predefined swatches or custom values.
A “Select Items” button to enable item selection mode within the plot.
A “Change Color” button to apply the selected color to the currently selected items.
A hidden dcc.Store to keep track of the selection mode state (enabled/disabled).
- Returns:
A fully constructed AccordionItem containing the color editing UI for selected plot items.
- Return type:
dmc.AccordionItem
Notes
The component assumes that callbacks elsewhere in the app handle selection logic and color application.
Styling is handled using Bootstrap classes (d-flex, justify-content-evenly, my-2, etc.) and inline styles.
Color swatches include commonly used HEX values to improve usability.
Component IDs
“color-input”: The HEX color selector input.
“select-items-button”: Triggers selection mode for interactive elements.
“select-items-button-store”: A hidden Store tracking whether selection mode is active.
“change-gene-color-button”: Applies the selected color to all currently selected items.
- homologyviz.layout.make_accordion_item_edit_sequence_annotations()[source]
Create the Dash Mantine Components AccordionItem for editing the annotations of sequences.
- Return type:
AccordionItem
- homologyviz.layout.make_accordion_item_homology()[source]
Create a Dash Mantine Components AccordionItem for customizing homology region colors.
This UI component allows users to:
Select a sequential color scale for homology identity shading.
Preview the selected colormap in a static Plotly graph.
Adjust the effective identity range using a range slider.
Choose between truncating the colormap or setting it to the full (extreme) homology range.
Apply changes to the visualization with a button click.
- Returns:
A fully constructed AccordionItem containing UI controls for modifying the homology color mapping in the plot.
- Return type:
dmc.AccordionItem
Notes
The dropdown menu (make_dmc_select) uses available sequential color scales.
A small preview of the current color scale is shown via a static dcc.Graph.
The range slider allows users to limit the range of identity values visualized (e.g., 0-75%).
Two buttons (“Truncate” and “Extreme”) toggle how the color scale range is handled.
The “Update Homologies” button triggers a callback to re-render regions with the selected color scale and identity thresholds.
Component IDs
“color-scale”: Dropdown for selecting a colormap.
“color-scale-display”: Plotly graph displaying a preview of the colormap.
“range-slider”: Slider to adjust the visible range of homology identity.
“truncate-colorscale-button”: Button indicating colormap is truncated.
“extreme-homologies-button”: Button for stretching the colormap to extremes.
“is-set-to-extreme-homologies”: Hidden Store tracking colormap state.
“change-homology-color-button”: Button to apply updated color mapping.
- homologyviz.layout.make_accordion_item_insert_title()[source]
Create a Dash Mantine Components AccordionItem for adding a title to the plot.
This UI component includes:
A ColorInput widget for selecting a color (HEX format) from predefined swatches or custom values.
A “Select Items” button to enable item selection mode within the plot.
A “Change Color” button to apply the selected color to the currently selected items.
A hidden dcc.Store to keep track of the selection mode state (enabled/disabled).
- Returns:
A fully constructed AccordionItem containing the color editing UI for selected plot items.
- Return type:
dmc.AccordionItem
Notes
The component assumes that callbacks elsewhere in the app handle selection logic and color application.
Styling is handled using Bootstrap classes (d-flex, justify-content-evenly, my-2, etc.) and inline styles.
Color swatches include commonly used HEX values to improve usability.
Component IDs
“color-input”: The HEX color selector input.
“select-items-button”: Triggers selection mode for interactive elements.
“select-items-button-store”: A hidden Store tracking whether selection mode is active.
“change-gene-color-button”: Applies the selected color to all currently selected items.
- homologyviz.layout.make_dmc_select(**kwargs)[source]
Create a styled Dash Mantine Components (DMC) Select element.
This utility function returns a DMC Select component with predefined styling, including fixed width, padding, and consistent font size across input, label, and options. Additional keyword arguments are passed directly to the dmc.Select.
- Parameters:
**kwargs (dict) – Additional properties to customize the Select component (e.g., data, value, label).
- Returns:
A configured dmc.Select component ready to be used in the Dash layout.
- Return type:
Component
- homologyviz.layout.make_layout_control_panel()[source]
Create the left-side control panel layout for the HomologyViz Dash app.
This panel includes: - The HomologyViz logo at the top. - A vertically scrollable dbc.Tabs menu for navigation between key UI sections:
Main (file input, sequence selection)
View (customization of layout and display)
Edit (annotation and color editing)
Save (export options)
- Returns:
A styled Dash HTML Div component containing the control panel layout.
- Return type:
html.Div
- homologyviz.layout.make_layout_plot_panel()[source]
Create the right-side plot panel layout for the HomologyViz Dash app.
This panel includes: - A dcc.Graph component where the main BLASTn alignment figure is rendered. - A dmc.Skeleton component used as a loading placeholder while the figure is
updating.
The layout is styled to occupy nearly full vertical height and has a visible border.
- Returns:
A styled Dash HTML Div containing the main plot area and loading skeleton.
- Return type:
html.Div
- homologyviz.layout.make_offcanvas_segment_control()[source]
Make offcanvas segment control
- Return type:
Div
- homologyviz.layout.make_offcanvas_sequence_table()[source]
Make the offcanvas sequence table
- Return type:
dag.AgGrid
- homologyviz.layout.make_tab_edit()[source]
Create the ‘Edit’ tab layout for the HomologyViz interface.
This tab allows users to customize visual aspects of the plot, including:
Selecting specific gene or homology traces and applying custom colors.
Picking from a list of predefined colors using a color input.
Changing the colormap used for homology identity shading.
Adjusting the colormap range (e.g., truncating or setting extreme bounds).
Previewing the selected colormap via a horizontal colorbar.
Updating the plot to reflect all visual changes.
UI Elements:
Color input with swatches and RGB support.
Buttons for selecting items and applying color changes.
Dropdown to choose a Plotly sequential colorscale.
Static plot to preview the colorscale.
Range slider to control truncation percentage.
Button group to toggle between truncating or fixing homology value bounds.
Button to apply the updated homology colormap.
- Returns:
A Dash Bootstrap Component Tab containing the UI layout for the “Edit” tab.
- Return type:
dbc.Tab
- homologyviz.layout.make_tab_main()[source]
Create the ‘Main’ tab layout for the HomologyViz interface.
This tab provides users with the interface to upload GenBank files, manage them in a table, and control the main plotting functions. It includes:
A drag-and-drop upload area for .gb or .gbk files.
An AG Grid table to display and manage uploaded file names.
- Buttons for:
Deleting selected files
Resetting the app
Erasing the plot
Drawing the plot
- Returns:
A Dash Bootstrap Component Tab containing the UI layout for the “Main” tab.
- Return type:
dbc.Tab
- homologyviz.layout.make_tab_save()[source]
Create the ‘Save’ tab layout for exporting the plotted figure.
This tab allows users to customize export settings and download the current plot in various formats. It provides controls to define output dimensions and scale.
UI Elements:
Format selector (PNG, JPG, PDF, SVG, or HTML).
Numeric inputs for specifying figure width, height, and scale.
Download button that triggers file generation and download.
Dash dcc.Download component to handle file delivery.
- Returns:
A Dash Bootstrap Component Tab containing the UI layout for the “Save” tab.
- Return type:
dbc.Tab
- homologyviz.layout.make_tab_view()[source]
Create the ‘View’ tab layout for the HomologyViz interface.
This tab allows users to customize how the DNA sequences and homology regions are displayed in the plot. Users can adjust layout alignment, annotations, and minimum homology length threshold.
Features included:
Dropdowns for: - Aligning sequences (left, center, right) - Choosing gene info source (gene or product) - Annotating genes (none, top, bottom, or both) - Annotating DNA sequences (accession, name, or file name) - Toggling the scale bar
Number input to set the minimum homology length to display
Button to apply view updates to the plot
- Returns:
A Dash Bootstrap Component Tab containing the UI layout for the “View” tab.
- Return type:
dbc.Tab
homologyviz.miscellaneous module
General-purpose utility functions used throughout the HomologyViz application.
This module provides helper functions for common tasks such as file deletion, directory cleanup, and locating package resources. These are used internally by multiple components (e.g., BLAST preparation, temporary file handling).
Notes
This file is part of HomologyViz
BSD 3-Clause License
Copyright (c) 2024, Iván Muñoz Gutiérrez
- homologyviz.miscellaneous.clean_directory(directory_path)[source]
Recursively delete all files and subdirectories from the specified directory.
This function removes all contents of the directory, including nested files and non- empty subdirectories. The target directory itself is not deleted, only its contents.
- Parameters:
directory_path (pathlib.Path) – Path to the directory to be cleaned.
- Return type:
None
- homologyviz.miscellaneous.delete_files(documents)[source]
Delete a list of files from the filesystem.
Iterates through the provided list of file paths and attempts to delete each one. If a file does not exist, a message is printed and the function continues without raising an error.
- Parameters:
documents (list) – List of file paths (as strings or Path-like objects) to be deleted.
- Return type:
None
- homologyviz.miscellaneous.get_os()[source]
Detect the current operating system.
- Returns:
A string identifying the OS: “Windows”, “macOS”, “Linux”, or “Unknown”.
- Return type:
str
- homologyviz.miscellaneous.get_package_path(package='homologyviz')[source]
Return the filesystem path to the root directory of the specified package.
Useful in src/-layout projects for locating bundled resources (e.g., templates, static files) at runtime. This uses Python’s importlib.resources to safely access installed package data in a cross-platform way.
- Parameters:
package (str, default="homologyviz") – The name of the package whose base path is being retrieved.
- Returns:
path – Filesystem path to the package directory.
- Return type:
pathlib.Path
- homologyviz.miscellaneous.is_blastn_installed()[source]
Check whether the BLASTn program is installed and accessible from the system PATH.
This function attempts to run blastn -version and returns True if the command executes successfully, indicating that BLASTn is available.
- Returns:
True if BLASTn is installed and accessible, False otherwise.
- Return type:
bool
- homologyviz.miscellaneous.round_up_to_nearest_significant_digit(number)[source]
Round a number up to the nearest multiple of its most significant digit.
This function rounds a given number up to the nearest “clean” value based on its most significant digit. It is useful for generating scale bar or axis limits in plots that are easy to interpret in plots.
This function is used in HomologyViz to define the scale bar values.
Examples
>>> round_up_to_nearest_significant_digit(142)
200
>>> round_up_to_nearest_significant_digit(89)
90
>>> round_up_to_nearest_significant_digit(5)
5
- Parameters:
number (float) – The number to round up.
- Returns:
The input number rounded up to the nearest multiple of its most significant digit.
- Return type:
int
homologyviz.parameters module
Class for storing plot configuration and metadata during Dash callbacks.
This module defines the PlotParameters class, which centralizes all relevant data needed for plotting in the HomologyViz app. It is used to share state between callbacks and to retain user-defined options and metadata derived from GenBank and BLASTn results.
Notes
This file is part of HomologyViz
BSD 3-Clause License
Copyright (c) 2024, Iván Muñoz Gutiérrez
- class homologyviz.parameters.PlotParameters(input_files=None, number_gb_records=None, output_folder=None, alignments_position=None, identity_color=None, colorscale_vmin=None, colorscale_vmax=None, set_colorscale_to_extreme_homologies=None, annotate_sequences=None, annotate_genes=None, annotate_genes_with=None, style_homology_regions=None, minimum_homology_length=None, add_scale_bar=None, selected_traces=None, lowest_identity=None, highest_identity=None, longest_sequence=None, gb_df=None, cds_df=None, alignments_df=None, alignments_regions_df=None, draw_from_button=None, y_separation=None, plot_title='')[source]
Bases:
objectStore alignments information and user input for plotting in Dash.
This class was designed to collect information during the Dash callbacks.
- Parameters:
input_files (Path) – List of genbank files to BLAST.
number_gb_records (int) – Number of gb files to BLAST.
output_folder (Path) – Path to output any result. This can be the path to a temporary directory.
alignments_position (str) – Position of the alignemts in the plot. Options are left, center, or right.
identity_color (str) – Selected colormap to show the different shades that represent identities. For example Greys, Greens, and Blues.
colorscale_vmin (float) – Minimum value to use in the colormap to represent identities. Values can go from 0 to 1.0; for example, a value of 0.5 represents the shade at the center of the colormap.
colorscale_vmax (float) – Maximum value to use in the colormap to represent identities. Values can go from 0 to 1.0; for example, a value of 1.0 represents the shade with the highest value in the colormap.
set_colorscale_to_extreme_homologies (bool) – If this parameter is set to True, the lowest and highest homologies will be represented by the values used in colorscale_vmin and colorscale_vmax, respectively. Otherwise, the lowest and highest homologies will be represented by 0 and 1.0 in the colorsle by, respectively.
annotate_sequences (str) – Annotate DNA sequences. Options: - no: no annotations - accession: use the accesion number - name: use the sequence name - fname: use the file name
annotate_genes (str) – Annotate genes on the DNA sequences. Options: - no: no annotations - top: annotate only the genes at the top sequence. - bottom: annotate only the genes at the bottom sequence. - top-bottom: annotate only the genes at the top and bottom sequences.
annotate_genes_with (str) – Annotate genes using GenBank file metadata stored in CDS gene or CDS product. Options are gene and product.
style_homology_regions (str) – Homology connector style. Options: - straight : the shadows representing homologies will have straight lines. - curve : the shadows reprenting homologies will have a Bezier shape.
minimium_homology_lenght (int) – This number represent the lenght of the minimum homology shown in the plot. For example, if it is set to 500, all homologies spanning 500 or more nucleotides are shown.
add_scale_bar (str) – Show the scale bar in plot. Option are yes or no.
selected_traces (list) – List of curve_numbers of selected traces. This list is used when the user selec genes in the edit tab to change their colors.
lowest_identity (float) – Lowest identity in the BLASTn analysis.
highest_identity (float) – Highest identity in the BLASTn analysis.
longest_sequence (int) – Lenght of the longest sequence during the BLASTn analysis.
gb_df (pandas.DataFrame) – Pandas DataFrame storing metadata of the GenBank files for plotting.
cds_df (pandas.DataFrame) – Pandas DataFrame storing metadata of the GenBank CDS files for plotting.
alignments_df (pandas.DataFrame) – Pandas DataFrame storing metadata of the BLASTn results for plotting.
alignments_regions_df (pandas.DataFrame) – Pandas DataFrame stroing metadata from the homology regions found after BLASTning for plotting.
draw_from_button (str) – Stores the name id of the button that triggered the callback for plotting. This parameter is import to distinguish between the Draw button and the rest of buttons used to update the plot. The id for the Draw button is draw-button.
y_separation (float) – Number to plot the sequences in the y-axis. The values to plot in the x-axis are stored in the different Pandas DataFrames.
plot_title (str) – Stores the plot’s title provided by the user.
homologyviz.plotter module
Functions and classes to generate graphical representations of BLASTn alignments.
Homology Visualization (HomologyViz) uses GenBank files (.gb) to align sequences, plot genes, and visualize homology regions. Gene features are extracted from the CDS section of each GenBank file.
Gene color customization is supported by adding a /Color qualifier to a CDS feature.
- For example:
/Color=”#00ff00”
will render the gene in green. If no color is provided, HomologyViz defaults to yellow.
Notes
This file is part of HomologyViz
BSD 3-Clause License
Copyright (c) 2024, Iván Muñoz Gutiérrez
- homologyviz.plotter.add_or_remove_title(fig, title)[source]
Update the Plotly figure by adding or removing its title accordingly.
If the provided title harbors only whitespace, the figure title is removed. Otherwise, the new title is set and centered.
- Parameters:
figure (plotly.graph_objects.Figure) – The Plotly figure to modify.
title (str) – The figure’s title. If the str is empty or harbors only whitespace, no title is added, helping to remove the title during Dash callbacks.
- Returns:
fig – The updated Plotly figure.
- Return type:
plotly.graph_objects.Figure
- homologyviz.plotter.annotate_all_genes_above(fig, annotate_genes_with, number_gb_records, cds_records, y_separation=10)[source]
Add vertical text annotations above all genes.
This function annotates genes using a specified metadata field (e.g., gene name or product). Annotations are positioned above gene arrows and are rotated vertically.
- Parameters:
fig (plotly.graph_objects.Figure) – The Plotly figure to which annotations will be added.
annotate_genes_with (str) – The metadata field to use for labeling each gene (e.g., “gene”, “product”).
number_gb_records (int) – Total number of GenBank records, used to calculate the top y-axis position.
cds_records (pandas.DataFrame) – A DataFrame containing CDS metadata. Must include the following columns: - ‘file_number’, ‘start_plot’, ‘end_plot’, - and the column specified by annotate_genes_with (‘gene’ and ‘product’).
y_separation (int, default=10) – Vertical spacing between sequence rows; controls annotation height.
- Returns:
fig – The updated Plotly figure with gene annotations added above the top sequence.
- Return type:
plotly.graph_objects.Figure
- homologyviz.plotter.annotate_all_genes_below(fig, annotate_genes_with, number_gb_records, cds_records, y_separation=10)[source]
Add vertical text annotations below all genes.
This function annotates genes using a specified metadata field (e.g., gene name or product). Annotations are positioned below gene arrows and are rotated vertically.
- Parameters:
fig (plotly.graph_objects.Figure) – The Plotly figure to which annotations will be added.
annotate_genes_with (str) – The metadata field to use for labeling each gene (e.g., “gene”, “product”).
number_gb_records (int) – Total number of GenBank records, used to calculate the top y-axis position.
cds_records (pandas.DataFrame) – A DataFrame containing CDS metadata. Must include the following columns: - ‘file_number’, ‘start_plot’, ‘end_plot’, - and the column specified by annotate_genes_with (‘gene’ and ‘product’).
y_separation (int, default=10) – Vertical spacing between sequence rows; controls annotation height.
- Returns:
fig – The updated Plotly figure with gene annotations added above the top sequence.
- Return type:
plotly.graph_objects.Figure
- homologyviz.plotter.annotate_bottom_genes(fig, annotate_genes_with, number_gb_records, cds_records, y_separation=10)[source]
Add vertical text annotations for genes on the bottom sequence row.
This function annotates genes from the last GenBank file (file_number == number_gb_records - 1) using a specified metadata field (e.g., gene name or product). Annotations are positioned below the bottom row of gene arrows and rotated vertically for readability.
- Parameters:
fig (plotly.graph_objects.Figure) – The Plotly figure to which annotations will be added.
annotate_genes_with (str) – The metadata field to use for labeling each gene (e.g., “gene” or “product”).
number_gb_records (int) – Total number of GenBank records, used to identify the bottom sequence.
cds_records (pandas.DataFrame) – A DataFrame containing CDS metadata. Must include the following columns: - ‘file_number’, ‘start_plot’, ‘end_plot’ - and the column specified by annotate_genes_with (‘gene’ or ‘product’).
y_separation (int, default=10) – Vertical spacing between sequence rows; controls annotation height.
- Returns:
fig – The updated Plotly figure with gene annotations added below the bottom sequence.
- Return type:
plotly.graph_objects.Figure
- homologyviz.plotter.annotate_dna_sequences(fig, gb_records, longest_sequence, number_gb_records, annotate_with='accession', y_separation=10, padding=10)[source]
Add text annotations to DNA sequence lines using metadata from GenBank records.
This function appends labels to the right of each sequence line, based on user preference. Labels can include the sequence’s accession number, internal name, or original filename. The annotations are positioned with consistent vertical spacing.
- Parameters:
fig (plotly.graph_objects.Figure) – The Plotly figure to which annotations will be added.
gb_records (pandas.DataFrame) – A DataFrame containing metadata for each GenBank sequence. Expected columns include: - ‘accession’, ‘record_name’, and ‘file_name’.
longest_sequence (int) – Length of the longest sequence, used to offset the annotation on the x-axis.
number_gb_records (int) – Total number of sequences to be annotated (used to calculate vertical placement).
annotate_with (str, default="accession") – Field to use for annotation. Must be one of: - “accession” (e.g., NCBI ID) - “name” (internal record name) - “fname” (original file name)
y_separation (int, default=10) – Vertical spacing between each sequence line.
padding (int, default=10) – Horizontal space between the end of the longest sequence and its annotation.
- Returns:
fig – The updated Plotly figure with sequence annotations added.
- Return type:
plotly.graph_objects.Figure
- homologyviz.plotter.annotate_genes(fig, plot_parameters)[source]
Annotate gene features on the top, bottom, or all sequence rows based on user preferences.
This function uses the PlotParameters object to determine how and where gene annotations should be applied. It delegates to annotate_top_genes and/or annotate_bottom_genes depending on the value of plot_parameters.annotate_genes.
- Parameters:
fig (plotly.graph_objects.Figure) – The Plotly figure to which gene annotations will be added.
plot_parameters (PlotParameters) –
- An object containing configuration and metadata, including:
annotate_genes: str, one of “top”, “bottom”, “top-bottom”, “all-above”, or “all-below”
annotate_genes_with: str, column name to use for labels (e.g., “gene”, “product”)
cds_df: DataFrame with CDS metadata
number_gb_records: int, number of GenBank files
y_separation: int, spacing between sequence rows
- Returns:
fig – The updated Plotly figure with gene annotations applied according to settings.
- Return type:
plotly.graph_objects.Figure
- homologyviz.plotter.annotate_top_genes(fig, annotate_genes_with, number_gb_records, cds_records, y_separation=10)[source]
Add vertical text annotations for genes on the top sequence row.
This function annotates genes from the first GenBank file (file_number == 0) using a specified metadata field (e.g., gene name or product). Annotations are positioned above the top row of gene arrows and are rotated vertically.
- Parameters:
fig (plotly.graph_objects.Figure) – The Plotly figure to which annotations will be added.
annotate_genes_with (str) – The metadata field to use for labeling each gene (e.g., “gene”, “product”).
number_gb_records (int) – Total number of GenBank records, used to calculate the top y-axis position.
cds_records (pandas.DataFrame) – A DataFrame containing CDS metadata. Must include the following columns: - ‘file_number’, ‘start_plot’, ‘end_plot’, - and the column specified by annotate_genes_with (‘gene’ and ‘product’).
y_separation (int, default=10) – Vertical spacing between sequence rows; controls annotation height.
- Returns:
fig – The updated Plotly figure with gene annotations added above the top sequence.
- Return type:
plotly.graph_objects.Figure
- homologyviz.plotter.change_homology_color(figure, colorscale_name, vmin_truncate, vmax_truncate, set_colorscale_to_extreme_homologies=False, lowest_homology=None, highest_homology=None)[source]
Update the color of homology region traces based on identity values and a selected colorscale.
This function iterates over traces in a Plotly figure and updates the fillcolor and line.color properties based on the homology identity value stored in customdata. Color mapping is done using either a truncated or full-range colorscale.
- Expected structure of customdata for homology regions:
[ “identity”, identity_value: float, homology_length: int ]
- Parameters:
figure (dict) – A dictionary representation of a Plotly figure (typically from Dash state).
colorscale_name (str) – Name of the Plotly colorscale to use (e.g., “Greys”, “Viridis”).
vmin_truncate (float) – Lower bound (0-1) of the normalized identity range for color mapping.
vmax_truncate (float) – Upper bound (0-1) of the normalized identity range for color mapping.
set_colorscale_to_extreme_homologies (bool, default=False) – If True, stretch the color scale based on dataset-wide min/max identity values.
lowest_homology (float or None) – The minimum identity value in the dataset, required if using extreme homology scaling.
highest_homology (float or None) – The maximum identity value in the dataset, required if using extreme homology scaling.
- Returns:
figure – The updated Plotly figure dictionary with modified homology trace colors.
- Return type:
dict
- homologyviz.plotter.create_color_line(colors)[source]
Create a continuous horizontal color gradient to display a selected colorscale.
This function takes input from the dropdown menu in the Edit tab of the app, which lists all Plotly sequential colorscales (e.g., “Greys”, “Greens”, “GnBu”, “Blues_r”). It generates a slim heatmap that visually represents the full range of the selected colorscale, helping users preview how the color mapping will appear when applied to homology identity values.
- Parameters:
colors (str) – A Plotly sequential colorscale name (e.g., “Greys”, “Greens”, “GnBu”, and “Blues_r”).
- Returns:
figure – A Plotly figure showing a smooth horizontal color gradient without axes or labels.
- Return type:
plotly.graph_objects.Figure
- homologyviz.plotter.get_color_from_colorscale(value, colorscale_name='Greys')[source]
Retrieve an RGB color from a Plotly colorscale based on a normalized value.
This function samples a color from the specified Plotly colorscale using a value between 0 and 1. It’s useful for mapping numerical data (e.g., identity percentages) to a corresponding color.
- Parameters:
value (float) – A normalized value between 0 and 1 indicating the position within the colorscale.
colorscale_name (str, default="Greys") – The name of the Plotly colorscale to use (e.g., “Greys”, “Blues”, “Viridis”).
- Returns:
A string representing the RGB color (e.g., “rgb(200, 200, 200)”).
- Return type:
str
- homologyviz.plotter.get_truncated_colorscale(colorscale_name='Greys', vmin=0, vmax=0.75, n_samples=256)[source]
Generate a truncated Plotly colorscale between two normalized values.
This function samples a subset of a Plotly colorscale between vmin and vmax, returning a list of (position, color) tuples. It is useful for focusing a colorscale on a specific range of values (e.g., homology identity percentages).
For the “Greys” colorscale, the vmax is capped at 0.99 to prevent rendering issues that may cause the darkest values to appear incorrectly when vmax=1.
- Parameters:
colorscale_name (str, default="Greys") – The name of the Plotly colorscale to sample from.
vmin (float, default=0) – The lower bound of the normalized range (between 0 and 1).
vmax (float, default=0.75) – The upper bound of the normalized range (between 0 and 1).
n_samples (int, default=256) – Number of samples to generate across the specified range.
- Returns:
A list of (normalized_position, color_string) tuples representing the truncated colorscale.
- Return type:
list of tuple[float, str]
- homologyviz.plotter.hide_homology(figure, min_homology)[source]
Toggle visibility of homology traces based on their length.
This function inspects each trace in the Plotly figure and hides those representing homology regions whose length is less than or equal to min_homology. Length information is expected in the trace’s customdata.
- The expected structure of customdata is:
[ “identity”, identity_value: float, homology_length: int ]
- Parameters:
figure (plotly.graph_objects.Figure) – A Plotly figure object containing homology region traces with customdata.
min_homology (int) – Minimum homology length required for a region to remain visible.
- Returns:
figure – The updated figure with trace visibility toggled based on homology length.
- Return type:
plotly.graph_objects.Figure
- homologyviz.plotter.make_alignments(input_files, output_folder)[source]
Perform BLASTn alignments between input sequences and return metadata for plotting.
This function processes GenBank files to extract DNA sequences, runs BLASTn locally to identify alignments, and parses the results into structured Pandas DataFrames for visualization.
- Parameters:
input_files (list of pathlib.Path) – List of file paths pointing to input GenBank files.
output_folder (pathlib.Path) – Directory where temporary BLAST-related files will be written.
- Return type:
tuple[DataFrame,DataFrame,DataFrame,DataFrame]- Returns:
gb_df (pandas.DataFrame) – DataFrame with GenBank record metadata, including: - file path, file name, sequence length, file number, and accession number. Used to relate to CDS data (cds_df) by file number or accession.
cds_df (pandas.DataFrame) – DataFrame with coding sequence (CDS) metadata for each GenBank file, including: - gene name, product name, strand, start/end coordinates (both raw and for plotting), file number, and accession number.
alignments_df (pandas.DataFrame) – DataFrame summarizing BLASTn results per alignment, including: - alignment number, query name, hit name, query length, and hit length.
regions_df (pandas.DataFrame) – DataFrame describing individual regions of sequence similarity (homology) between aligned sequences. Includes: - alignment number (to relate to alignments_df) and region-level coordinates. See parse_blast_record in the gb_files_manipulation module for details.
- homologyviz.plotter.make_figure(plot_parameters)[source]
Create a multiple sequence alignment plot using BLASTn and GenBank metadata.
This function builds a complete Plotly figure for visualizing DNA sequences, gene annotations, and homology regions between multiple GenBank files. It uses the configuration and metadata provided in a fully populated PlotParameters object.
Components included in the plot (depending on user settings): - DNA sequences as horizontal lines - Genes as directional polygons (arrows) - Homology regions as color-coded polygons - Annotations for sequences and genes - Optional scale bar (in base pairs) - Optional color scale legend for identity values
- Parameters:
plot_parameters (PlotParameters) – Object containing all configuration settings and metadata needed to construct the plot. Must include parsed GenBank records, BLAST alignment results, color settings, visibility options, and layout preferences.
- Returns:
fig – A fully assembled Plotly figure ready for display in a Dash app.
- Return type:
plotly.graph_objects.Figure
- homologyviz.plotter.make_selection_effect(figure, curve_number)[source]
Visually highlight a selected trace by changing its line color and thickness.
This function adjusts the line color and width of a specific trace (based on its curve_number) to create a selection effect. It uses the trace’s current color to determine whether to use a dark or light outline for optimal contrast.
- Parameters:
figure (plotly.graph_objects.Figure) – The Plotly figure containing the trace to modify.
curve_number (int) – The index of the trace to update (corresponds to ‘curveNumber’ from Dash clickData).
- Returns:
figure – The updated figure with the specified trace visually emphasized.
- Return type:
plotly.graph_objects.Figure
- homologyviz.plotter.plot_colorbar_legend(fig, colorscale, min_value, max_value, set_colorscale_to_extreme_homologies=False)[source]
Add a horizontal colorbar legend to a Plotly figure to indicate homology identity range.
This function creates a dummy scatter trace with a customized colorbar to serve as a legend for the homology identity colors. It adjusts the color scale display and tick labels based on whether the full identity range or a truncated scale is being used.
- Parameters:
fig (plotly.graph_objects.Figure) – The Plotly figure to which the colorbar legend should be added.
colorscale (list of tuple[float, str]) – A Plotly-compatible colorscale representing identity values.
min_value (float) – The minimum identity value represented in the current color scale (normalized 0-1).
max_value (float) – The maximum identity value represented in the current color scale (normalized 0-1).
set_colorscale_to_extreme_homologies (bool, default=False) – If True, the color scale is stretched to the actual min and max identity values. If False, it uses a truncated range (e.g., based on a user-defined threshold).
- Returns:
fig – The updated Plotly figure with a horizontal identity colorbar legend.
- Return type:
plotly.graph_objects.Figure
- homologyviz.plotter.plot_dna_sequences(fig, gb_records, y_separation=10)[source]
Plot horizontal lines representing DNA sequences using metadata from a DataFrame.
This function iterates over a DataFrame of GenBank metadata and draws one horizontal line per sequence, spaced vertically by y_separation. Each line represents a DNA sequence from the dataset and is labeled with the sequence name.
- Parameters:
fig (plotly.graph_objects.Figure) – The Plotly figure to which the sequence lines will be added.
gb_records (pandas.DataFrame) – A DataFrame containing metadata for each sequence, including: - ‘sequence_start’ - ‘sequence_end’ - ‘record_name’
y_separation (int, default=10) – The vertical distance between stacked sequence lines.
- Returns:
fig – The updated Plotly figure with all DNA sequences plotted as horizontal lines.
- Return type:
plotly.graph_objects.Figure
- homologyviz.plotter.plot_genes(fig, number_gb_records, longest_sequence, cds_records, name_from='product', y_separation=10)[source]
Plot arrows representing genes using metadata from a CDS DataFrame.
This function iterates over coding sequence (CDS) entries grouped by GenBank file. Each gene is rendered as a directional polygon (arrow) positioned on the y-axis according to the file order. Arrowhead size is scaled relative to the longest sequence to maintain proportionality.
- Parameters:
fig (plotly.graph_objects.Figure) – The Plotly figure to which gene arrows will be added.
number_gb_records (int) – The total number of GenBank files, used to calculate vertical placement.
longest_sequence (int) – The length of the longest DNA sequence, used to scale arrowhead size.
cds_records (pandas.DataFrame) – A DataFrame containing gene metadata. Expected columns include: - ‘file_number’ - ‘cds_number’ - ‘start_plot’ - ‘end_plot’ - ‘color’ - ‘product’ - ‘gene’
name_from (str, default="product") – Determines the label shown for each gene: either “product” or “gene”.
y_separation (int, default=10) – Vertical spacing between rows of gene arrows for different GenBank files.
- Returns:
fig – The updated Plotly figure with gene arrows plotted for each sequence.
- Return type:
plotly.graph_objects.Figure
- homologyviz.plotter.plot_homology_regions_with_dataframe(fig, alignments_df, regions_df, y_separation=10, homology_padding=1.1, colorscale='Greys', straight_heights=True, minimum_homology_length=1, set_colorscale_to_extreme_homologies=False, lowest_homology=None, highest_homology=None)[source]
Plot homology regions as filled polygons using metadata from alignment dataframes.
This function visualizes BLASTn alignment regions as colored polygons between query and subject sequences. The color represents the identity percentage, based on a colorscale that may be truncated or stretched to fit user-defined identity bounds.
- Parameters:
fig (plotly.graph_objects.Figure) – The Plotly figure to which homology polygons will be added.
alignments_df (pandas.DataFrame) – A DataFrame with metadata about BLAST alignments. Expected columsn include: - ‘alignment_number’, ‘query_name’, ‘hit_name’, ‘query_len’, and ‘hit_len’.
regions_df (pandas.DataFrame) – A DataFrame containing the coordinates of individual homology blocks to plot. Expected columns include: - ‘alignment_number’, ‘query_from_plot’, ‘query_to_plot’, - ‘hit_from_plot’, ‘hit_to_plot’, and ‘homology’.
y_separation (int, default=10) – Vertical distance between stacked alignment rows.
homology_padding (float, default=1.1) – Padding added to the y-coordinates to offset polygon positioning for visual clarity.
colorscale (str) – Name of the Plotly colorscale used to color-code identity values.
straight_heights (bool, default=True) – If True, polygons are drawn with flat tops and bottoms. If False, curved edges are used for a smoother appearance.
minimum_homology_length (int, default=1) – Minimum length (in bp) for a homology region to be displayed.
set_colorscale_to_extreme_homologies (bool, default=False) – If True, colors are scaled using the dataset’s actual min/max identity values.
lowest_homology (float or None, optional) – The minimum identity value used for scaling (required if set_colorscale_to_extreme_homologies is True).
highest_homology (float or None, optional) – The maximum identity value used for scaling (required if set_colorscale_to_extreme_homologies is True).
- Returns:
fig – The updated Plotly figure with homology regions plotted as polygons.
- Return type:
plotly.graph_objects.Figure
- homologyviz.plotter.plot_line(fig, x_values, y_values, name=None, customdata=[], color='black')[source]
Add a thick horizontal line to the Plotly figure to represent a DNA sequence.
This function draws a straight line between the specified x and y coordinates. It is typically used to visualize the backbone of each DNA sequence in the alignment.
- Parameters:
fig (plotly.graph_objects.Figure) – The Plotly figure to which the line should be added.
x_values (list) – The x-coordinates defining the start and end of the line.
y_values (list) – The y-coordinates defining the vertical position of the line (usually constant).
name (str or None, optional) – Name label used for hover display and trace identification.
customdata (list, optional) – Extra data attached to the line, accessible via hover or callbacks.
color (str, default="black") – The color of the line (e.g., “black”, “#FF0000”, or “rgb(0,0,0)”).
- Returns:
The function modifies the input figure in-place and returns nothing.
- Return type:
None
- homologyviz.plotter.plot_polygon(fig, x_values, y_values, color='blue', name='', customdata=[], visible=True)[source]
Add a filled polygon to the Plotly figure to represent a gene or homology region.
This function draws a closed shape by connecting the points defined by x_values and y_values, and fills it with the specified color. It is used to visually represent genes, coding regions, or homology blocks on the plot.
- Parameters:
fig (plotly.graph_objects.Figure) – The Plotly figure to which the polygon should be added.
x_values (list) – The x-coordinates of the polygon vertices.
y_values (list) – The y-coordinates of the polygon vertices.
color (str, default="blue") – The color used for both the polygon outline and fill (RGB or hex format).
name (str, optional) – A label used for hovering (displayed as %{text}).
customdata (list, optional) – Extra data attached to each vertex, accessible in callbacks or hover events.
visible (bool, default=True) – Whether the polygon is initially visible in the plot.
- Returns:
The function modifies the input figure in-place and returns nothing.
- Return type:
None
- homologyviz.plotter.plot_scale(figure, length_longest_sequence, add_scale=True)[source]
Add a scale bar to the plot representing distance in base pairs (bp).
The scale length is calculated as one-fifth of the longest sequence, rounded up to the nearest significant digit for visual clarity. A line and label are drawn at the bottom of the figure to indicate scale. The scale can be hidden by setting add_scale=False.
- Parameters:
figure (plotly.graph_objects.Figure) – The Plotly figure to which the scale bar will be added.
length_longest_sequence (int) – Length of the longest DNA sequence in the plot (used to size the scale).
add_scale (bool, default=True) – Whether to display the scale. If False, a fully transparent line and label are added.
- Returns:
figure – The updated figure with the scale line and annotation.
- Return type:
plotly.graph_objects.Figure
- homologyviz.plotter.remove_annotations_by_name(figure, name)[source]
Remove annotations from a Plotly figure whose ‘name’ contains the given substring.
This function filters figure.layout[‘annotations’] and removes any annotations where the ‘name’ field contains the specified string. It is useful for dynamically updating or clearing labeled elements such as gene or sequence annotations.
- Parameters:
figure (plotly.graph_objects.Figure) – A Plotly figure object that may contain annotations.
name (str) – A substring to search for in the ‘name’ field of each annotation. Annotations matching this string will be removed.
- Returns:
figure – The updated Plotly figure with matching annotations removed.
- Return type:
plotly.graph_objects.Figure
- homologyviz.plotter.remove_traces_by_name(figure, name)[source]
Remove all traces from a Plotly figure dictionary whose ‘name’ contains a given substring.
This function is useful for removing dynamically generated traces (e.g., colorbar legends, annotations, or temporary highlights) based on partial name matching.
- Parameters:
figure (dict) – A dictionary representing a Plotly figure (as returned by dcc.Graph).
name (str) – A substring to match within the ‘name’ field of each trace. Any trace whose name contains this string will be removed.
- Returns:
The updated figure dictionary with the matching traces removed.
- Return type:
dict
- homologyviz.plotter.sample_colorscale_setting_lowest_and_highest_homologies(truncated_colorscale, homology_value, lowest_homology, highest_homology)[source]
Sample a color from a truncated colorscale based on actual homology value range.
This function maps a homology identity value to a position within a truncated colorscale, taking into account the actual minimum and maximum identity values in the dataset. This ensures consistent color mapping even when the colorscale has been stretched or truncated.
- Parameters:
truncated_colorscale (list of tuple[float, str]) – A colorscale defined by a list of (normalized_position, color_string) tuples.
homology_value (float) – The homology identity value to map (e.g., 0.83 for 83% identity).
lowest_homology (float) – The lowest identity value present in the dataset (used to normalize the range).
highest_homology (float) – The highest identity value present in the dataset.
- Returns:
The interpolated RGB color string corresponding to the input homology value.
- Return type:
str
- homologyviz.plotter.sample_from_truncated_colorscale(truncated_colorscale, homology_value)[source]
Sample a color from a truncated colorscale based on a normalized homology value.
This function interpolates between the first and last colors in a truncated Plotly colorscale using the given homology value (between 0 and 1), and returns the corresponding RGB color.
- Parameters:
truncated_colorscale (list of tuple[float, str]) – A colorscale defined by a list of (normalized_position, color_string) tuples. Typically produced by get_truncated_colorscale.
homology_value (float) – A value between 0 and 1 indicating the relative position to sample within the colorscale.
- Returns:
The interpolated RGB color string (e.g., “rgb(100, 150, 200)”).
- Return type:
str
- homologyviz.plotter.toggle_scale_bar(figure, show)[source]
Toggle the visibility of the scale bar by adjusting its alpha channel.
This function searches the figure for the scale bar shape and annotation using their names (“Scale bar” and “Scale annotation”). It modifies the color’s alpha value to either show or fully hide them without removing the elements.
- Parameters:
figure (plotly.graph_objects.Figure) – The Plotly figure containing the scale bar trace and annotation.
show (bool) – If True, make the scale bar visible. If False, hide it using transparent colors.
- Returns:
figure – The updated figure with the scale bar toggled on or off.
- Return type:
plotly.graph_objects.Figure
homologyviz.rectangle_bezier module
Generate coordinates for drawing rectangles with curved sides using Bézier curves.
This module defines the RectangleCurveHeight class, which calculates the x and y coordinates needed to plot homology regions as rectangles with smoothly curved vertical sides. This feature is intended for enhancing the visual distinction of homologous sequences in the HomologyViz app, offering an alternative to traditional straight-edge renderings.
Dependencies
bezier: Used to compute Bézier curve coordinates.
numpy: For efficient numerical operations and array handling.
plotly.graph_objects (optional): Used for plotting, though not directly invoked.
Usage
This module is not yet integrated into the HomologyViz GUI, but future versions may allow users to toggle between straight and curved homology representations.
Notes
This file is part of HomologyViz
BSD 3-Clause License
Copyright (c) 2024, Iván Muñoz Gutiérrez
- class homologyviz.rectangle_bezier.RectangleCurveHeight(x_coordinates, y_coordinates, proportions=[0, 0.1, 0.5, 0.9, 1], num_points=100)[source]
Bases:
objectGenerate coordinates for a rectangle with curved vertical sides using Bézier curves.
This class is designed to construct the shape of a homology region where the left and right vertical edges are represented as Bézier curves, giving the region a smoother and more dynamic appearance in graphical sequence alignment plots.
- Parameters:
x_coordinates (list[float]) – A list of 4 x-coordinates defining the corners of the rectangular region, ordered clockwise or counter-clockwise.
y_coordinates (list[float]) – A list of 4 y-coordinates corresponding to x_coordinates.
proportions (list[float], optional) – Proportional values between 0 and 1 defining the control points for the Bézier curve. Defaults to [0, 0.1, 0.5, 0.9, 1]. The curve shape depends on these.
num_points (int, optional) – Number of points used to render each Bézier curve. More points yield smoother curves. Default is 100.
- x_coordinates
Stores the x-values of the rectangle corners.
- Type:
list[float]
- y_coordinates
Stores the y-values of the rectangle corners.
- Type:
list[float]
- proportions
Used to shape the Bézier curves on the sides of the rectangle.
- Type:
list[float]
- degree
Degree of the Bézier curve, inferred from the number of proportions.
- Type:
int
- num_points
Number of points used to evaluate and render the Bézier curves.
- Type:
int
Notes
The Bézier curve rendering is powered by the bezier Python library. Ensure it is installed in your environment (e.g., via pip install bezier).
This class is intended for internal use by the HomologyViz plotting system.
- coordinates_rectangle_height_bezier()[source]
Get coordinates to plot a polygon resembling a rectangle with curved vertical sides.
This method constructs the full x and y coordinate arrays needed to draw a homology region shaped like a rectangle, but with both vertical edges replaced by Bézier curves. The top and bottom edges are straight.
- Returns:
tuple – A tuple containing: - x_points: The x-coordinates of the polygon. - y_points: The y-coordinates of the polygon.
- Return type:
[numpy.ndarray, numpy.ndarray]
Notes
The resulting polygon starts at the top-left, curves down the left edge, then follows the bottom edge to the right, curves up the right edge, and finally closes the shape by returning to the start.
- get_bezier_curve(curve, num_points=100)[source]
Evaluate a Bézier curve at evenly spaced intervals.
- Parameters:
curve (bezier.Curve) – A Bézier curve object created from control points using the bezier library.
num_points (int, optional) – Number of points to evaluate along the curve (default is 100).
- Returns:
tuple – A tuple containing the x and y coordinates of the evaluated Bézier curve.
- Return type:
[numpy.ndarray, numpy.ndarray]
- get_bezier_nodes_vertical(x1, x2, y1, y2, proportions=[0, 0.1, 0.5, 0.9, 1])[source]
Generate the x and y coordinates of a vertical Bézier curve between two points.
This function computes the Bézier curve using x-coordinates interpolated from x1 to x2 based on the given proportions, and y-coordinates spaced evenly from y1 to y2 for the curve degree determined by the proportions list.
- Parameters:
x1 (float) – Starting x-coordinate of the curve.
x2 (float) – Ending x-coordinate of the curve.
y1 (float) – Starting y-coordinate of the curve.
y2 (float) – Ending y-coordinate of the curve.
proportions (list of float, optional) – List of float values between 0 and 1 representing how control points are spaced along the x-axis. Must start at 0 and end at 1.
- Returns:
tuple – The x and y coordinates of the Bézier curve evaluated at evenly spaced intervals.
- Return type:
[numpy.ndarray, numpy.ndarray]
- x_points_bezier_vertical(x1, x2, proportions=[0, 0.1, 0.5, 0.9, 1])[source]
Generate x-coordinates for control points of a vertical Bézier curve.
This function calculates a list of x-values spaced according to the specified proportions between x1 and x2. These values are used to shape the curve horizontally, while the corresponding y-values are distributed vertically.
- Parameters:
x1 (float) – Starting x-coordinate of the curve.
x2 (float) – Ending x-coordinate of the curve.
proportions (list of float, default=[0, 0.1, 0.5, 0.9, 1]) – List of normalized positions (between 0 and 1) to interpolate between x1 and x2. Must start with 0 and end with 1. These determine the curvature profile.
- Returns:
list – A list of x-coordinates for Bézier control points, matching the provided proportions.
- Return type:
[float]
- y_points_bezier_vertical(y1, y2, degree)[source]
Generate y-coordinates for a vertical Bézier curve of given degree.
This function computes evenly spaced y-values between y1 and y2 for use as control points in a vertical Bézier curve. The number of output points equals degree + 1.
- Parameters:
y1 (float) – Starting y-coordinate of the curve.
y2 (float) – Ending y-coordinate of the curve.
degree (int) – Degree of the Bézier curve (determines the number of control points as degree + 1).
- Returns:
list – A list of y-coordinates evenly spaced between y1 and y2.
- Return type:
[float]